Spring Boot Prometheus使用
Spring Boot Prometheus使用
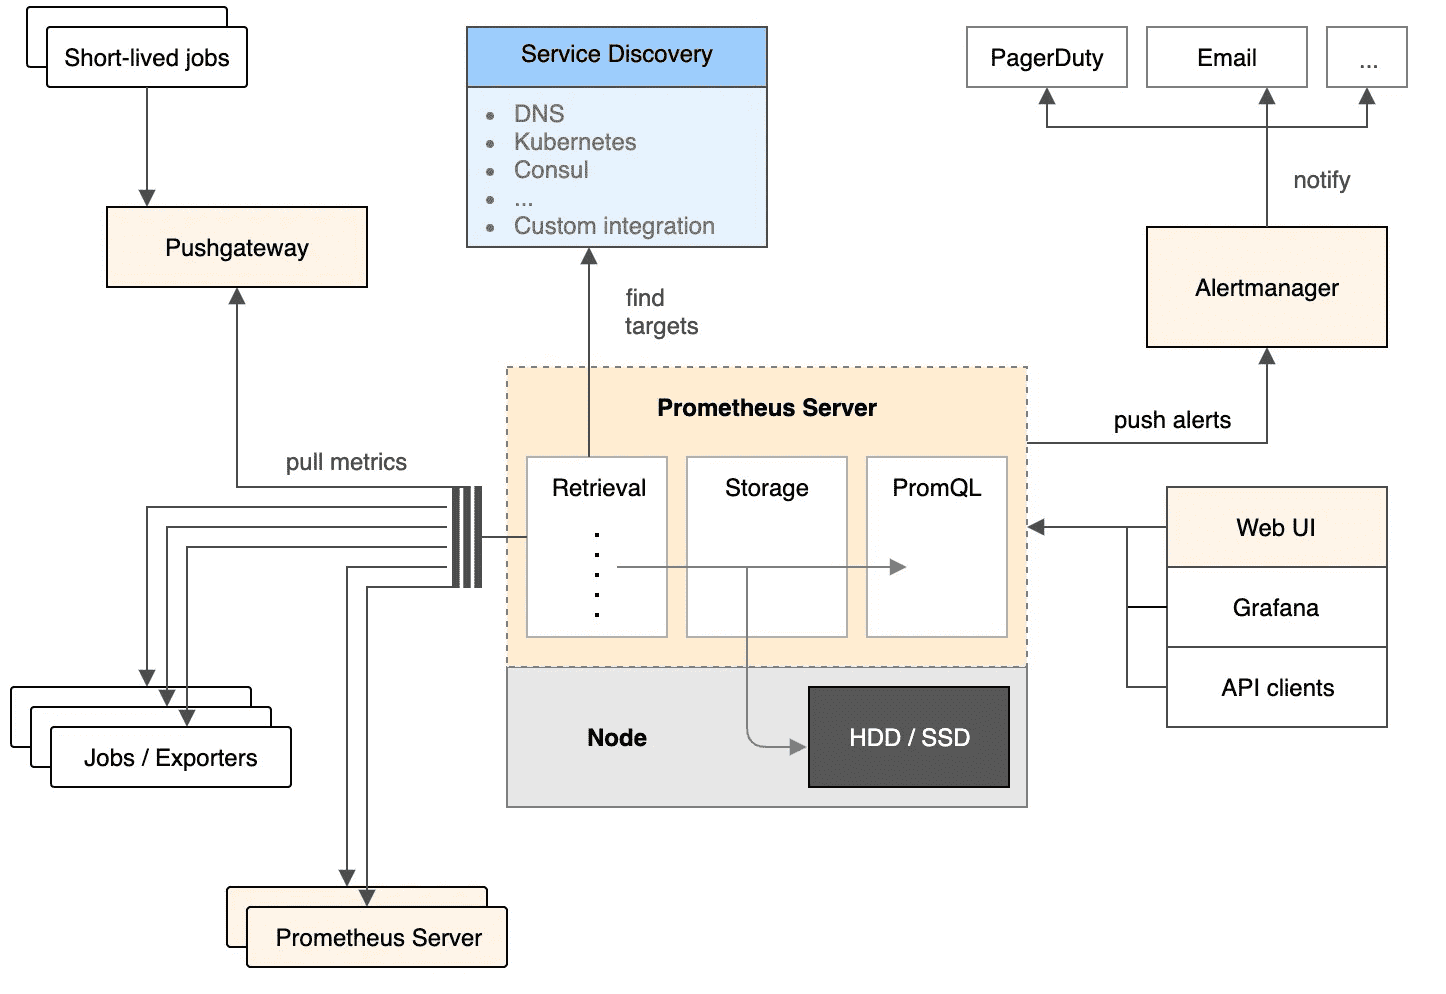
一、基本原理
Prometheus的基本原理是通过HTTP协议周期性抓取被监控组件的状态,任意组件只要提供对应的HTTP接口就可以接入监控。不需要任何SDK或者其他的集成过程。这样做非常适合做虚拟化环境监控系统,比如VM、Docker、Kubernetes等。输出被监控组件信息的HTTP接口被叫做exporter 。目前互联网公司常用的组件大部分都有exporter可以直接使用,比如Varnish、Haproxy、Nginx、MySQL、Linux系统信息(包括磁盘、内存、CPU、网络等等)。
二、具体过程
- Prometheus Daemon负责定时去目标上抓取metrics(指标)数据,每个抓取目标需要暴露一个http服务的接口给它定时抓取。Prometheus支持通过配置文件、文本文件、Zookeeper、Consul、DNS SRV Lookup等方式指定抓取目标。Prometheus采用PULL的方式进行监控,即服务器可以直接通过目标PULL数据或者间接地通过中间网关来Push数据。
- Prometheus在本地存储抓取的所有数据,并通过一定规则进行清理和整理数据,并把得到的结果存储到新的时间序列中。
- Prometheus通过PromQL和其他API可视化地展示收集的数据。Prometheus支持很多方式的图表可视化,例如Grafana、自带的Promdash以及自身提供的模版引擎等等。Prometheus还提供HTTP API的查询方式,自定义所需要的输出。
- PushGateway支持Client主动推送metrics到PushGateway,而Prometheus只是定时去Gateway上抓取数据。
- Alertmanager是独立于Prometheus的一个组件,可以支持Prometheus的查询语句,提供十分灵活的报警方式。
三、pull模式(prometheus主动拉取)
<dependency>
    <groupId>org.springframework.boot</groupId>
    <artifactId>spring-boot-starter-actuator</artifactId>
</dependency>
<dependency>
    <groupId>io.micrometer</groupId>
    <artifactId>micrometer-registry-prometheus</artifactId>
</dependency>management:
endpoints:
web:
exposure:
include: prometheus
metrics:
tags:
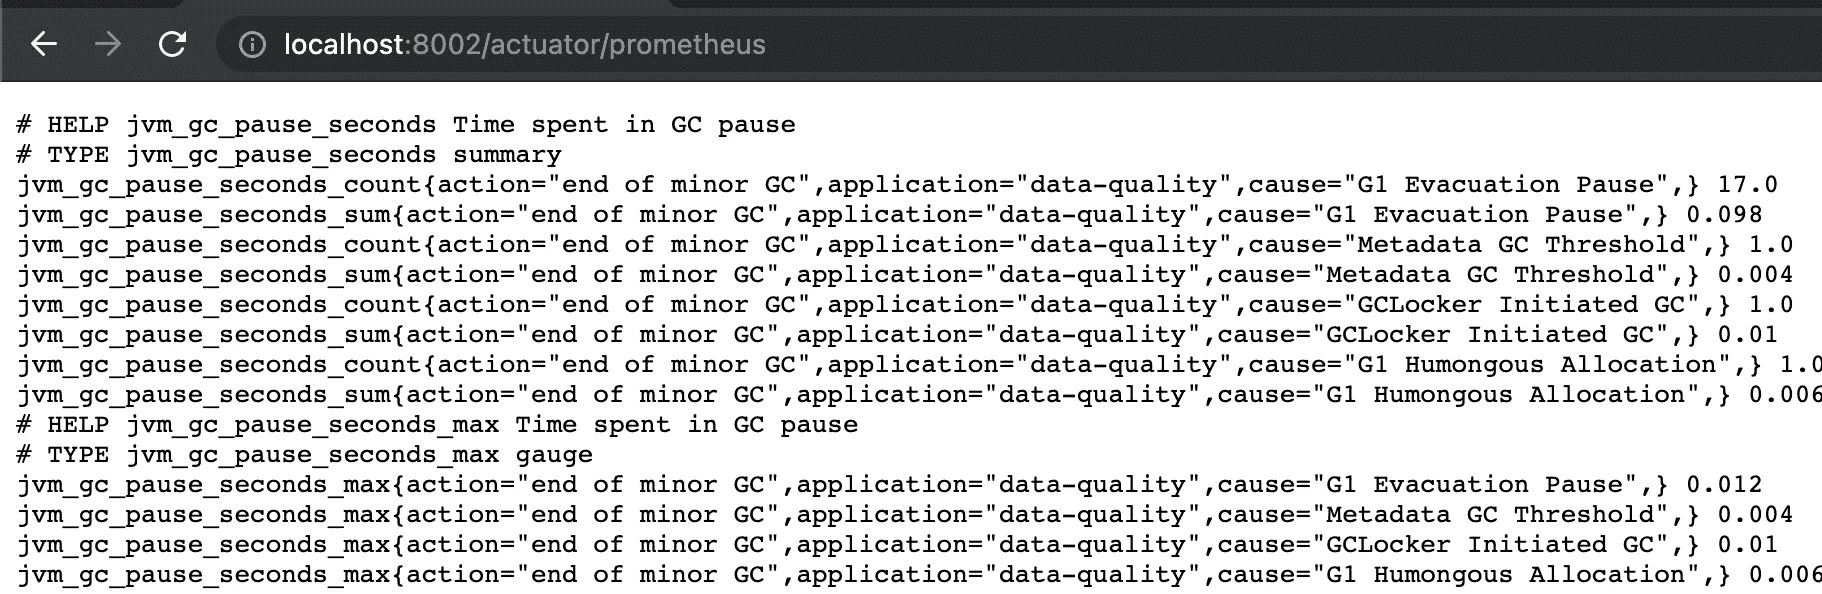
application: ${spring.application.name}之后查看/actuator/prometheus就可以看到
腾讯云上面有个prometheus的服务,接入云原生监控还要配置一个Servicemonitor、PodMonitor等,详细的可以访问腾讯云的官方文档(https://cloud.tencent.com/document/product/1416/56031)
四、主动上报(pushgateway)
大部分现实场景中,如果每增加一个服务,都需要开发去配置的话,不仅沟通成本高,也导致因配错而起的运维成本很高,采用主动上报方式比较简单,方便规避一些问题。
(1)引入库
主动上报除了需要引入spring-boot-starter-actuator、micrometer-registry-prometheus,还要引入simpleclient_pushgateway,三个都是必须的,少一个都不行。
        <dependency>
            <groupId>org.springframework.boot</groupId>
            <artifactId>spring-boot-starter-actuator</artifactId>
        </dependency>
        <dependency>
            <groupId>io.micrometer</groupId>
            <artifactId>micrometer-registry-prometheus</artifactId>
        </dependency>
        <dependency>
            <groupId>io.prometheus</groupId>
            <artifactId>simpleclient_pushgateway</artifactId>
        </dependency>
(2)修改配置文件
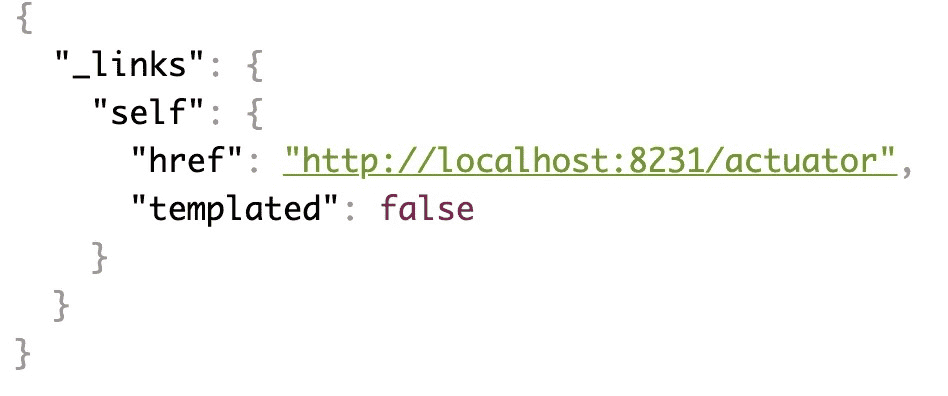
之后,为了安全考虑,需要把endpoints的所有信息都关闭掉,免得被泄露出去。
management:
  endpoints:
    #一定要设为false,防止不小心暴露/actuator相关接口触发安全工单
    enabled-by-default: false
  metrics:
    tags:
      #要设置应用的名称,否则会聚合到别的项目里面去
      application: ${spring.application.name}
    export:
      prometheus:
        pushgateway:
          base-url: http://xxxxx
          push-rate: 20s
          job: ${spring.application.name}
          enabled: true
          username: xxxx
          password: xxx
          grouping-key:
            instance: ${HOSTNAME}
最好多看一眼/actuator,确认一下是否已经关闭endpoints
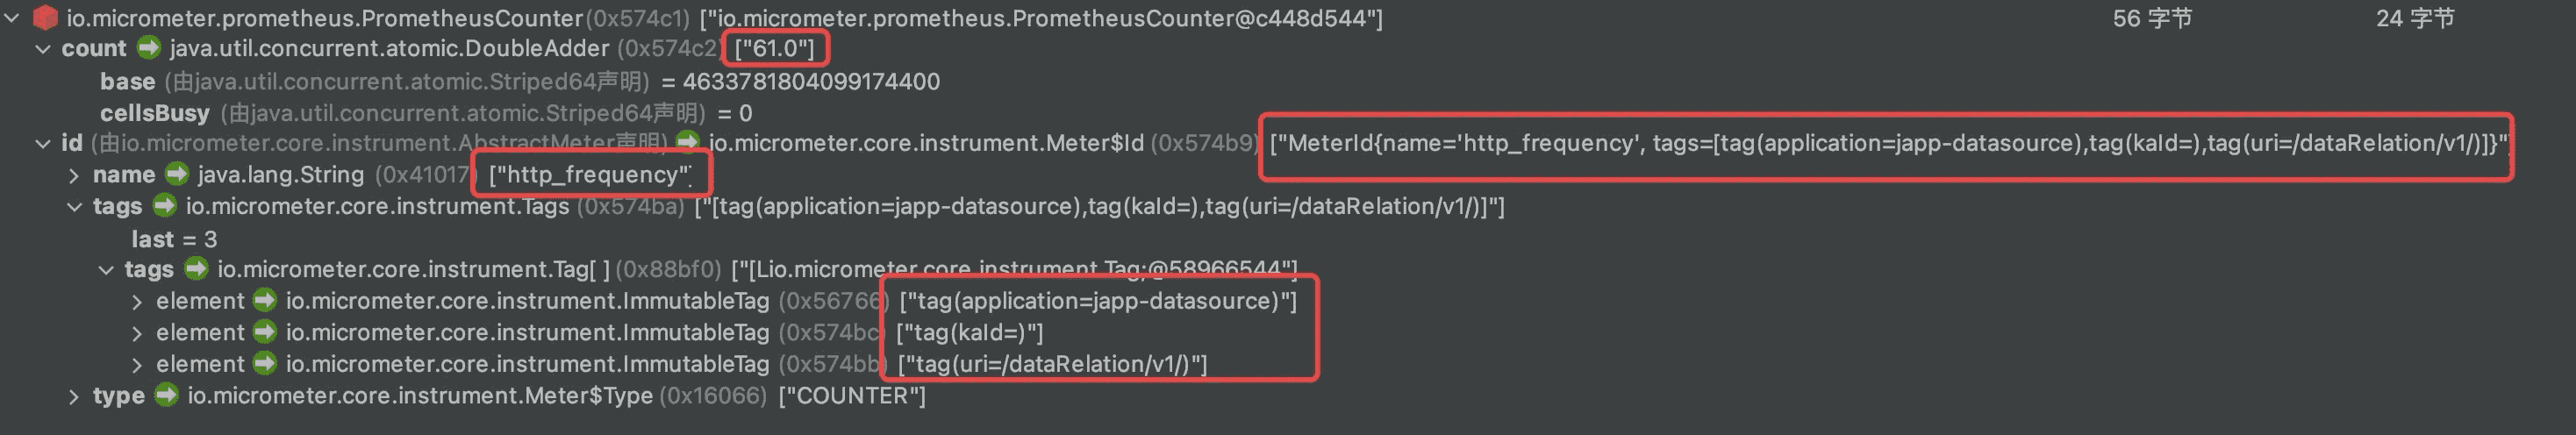
(3)抓包看一下metrics(可跳过)
大致看了下 simpleclient_pushgateway和spring-boot-starter-actuator的源码,并没有对http的请求发起日志,调试的时候都不知道是不是正常上报过去了,只能采取抓包来研究下。
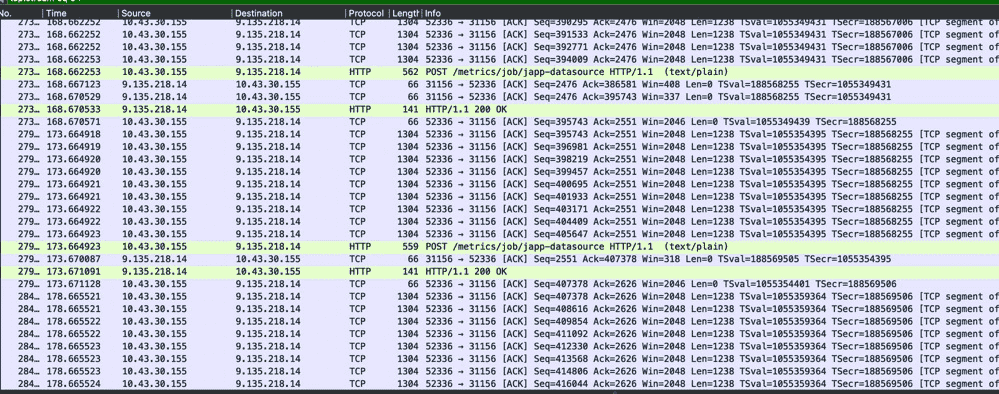
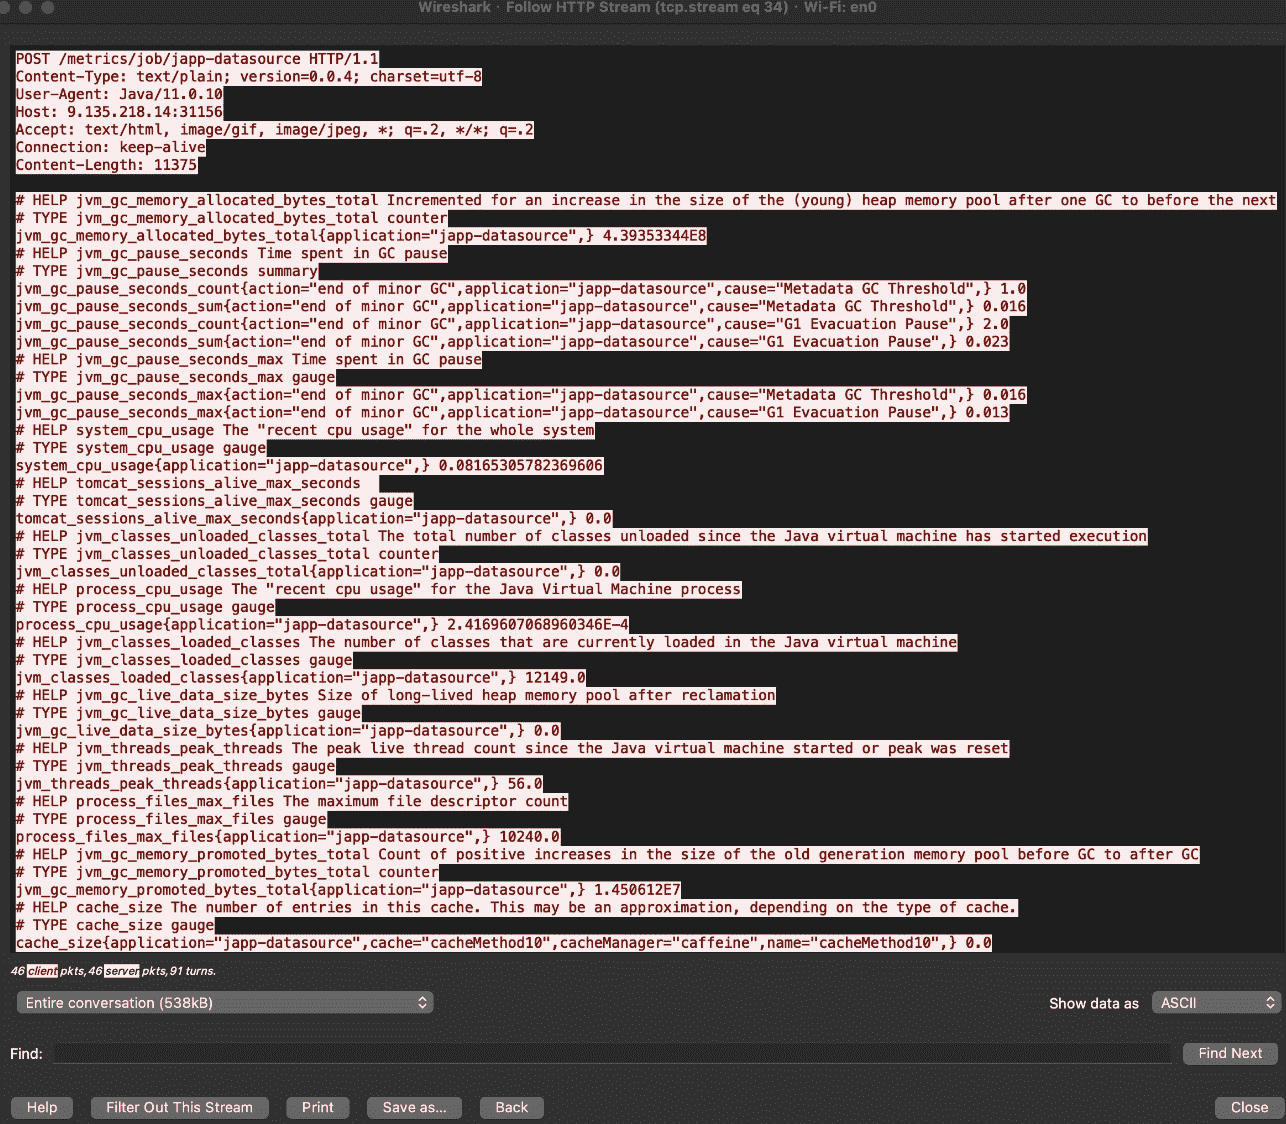
平均间隔5s左右,符合配置文件里的设置。
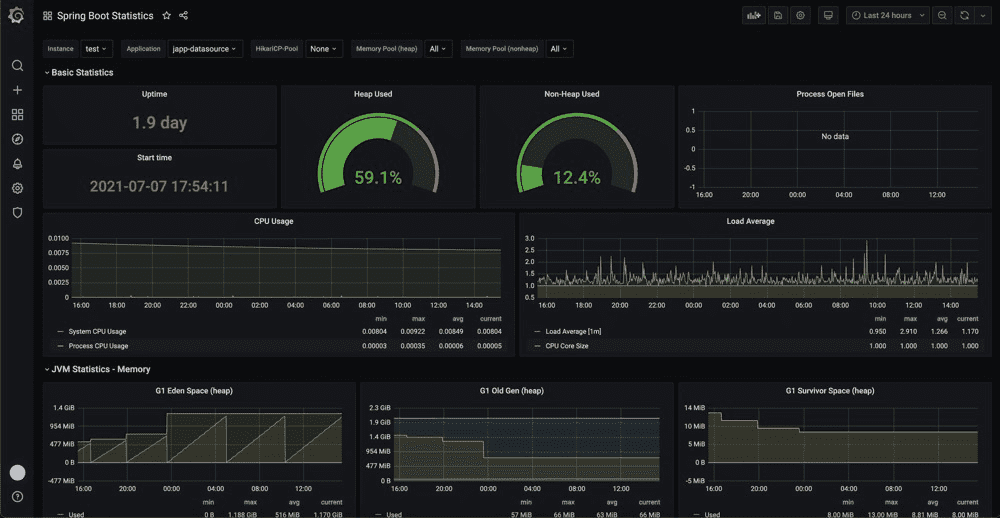
五、Grafana
对于java来说,常用的dashboard是https://grafana.com/grafana/dashboards/4701,也可以用spring boot的https://grafana.com/grafana/dashboards/6756
六、自定义监控上报
除了通用的封装好的指标之外,也可以自定义prometheus的监控。对于Spring Boot来说,只要如下代码即可实现:
    @Resource
    private MeterRegistry meterRegistry;

    public void report() {
        meterRegistry.counter("指标", "tag的名称", "tag的值").increment();
    }
也可以通过抓包来查看,以及在push-gateway上看到。